Mode
Business intelligence, explained without a diagram dump.
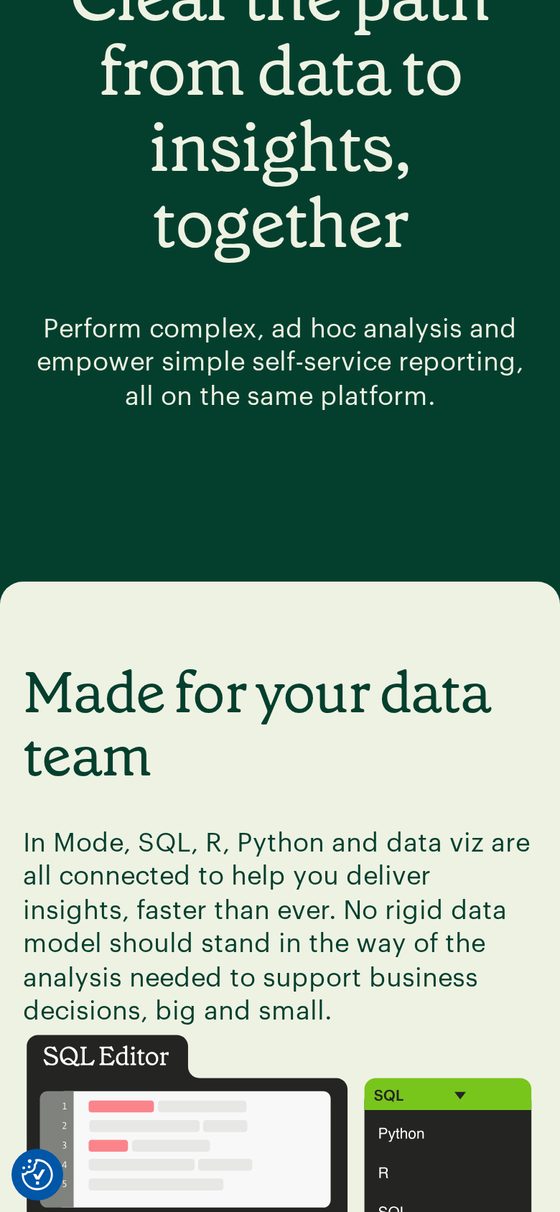
A platform site for a data analytics product: typographic headline blocks, the real notebook interface, and an isometric stack that explains where the product sits in a data team's workflow.
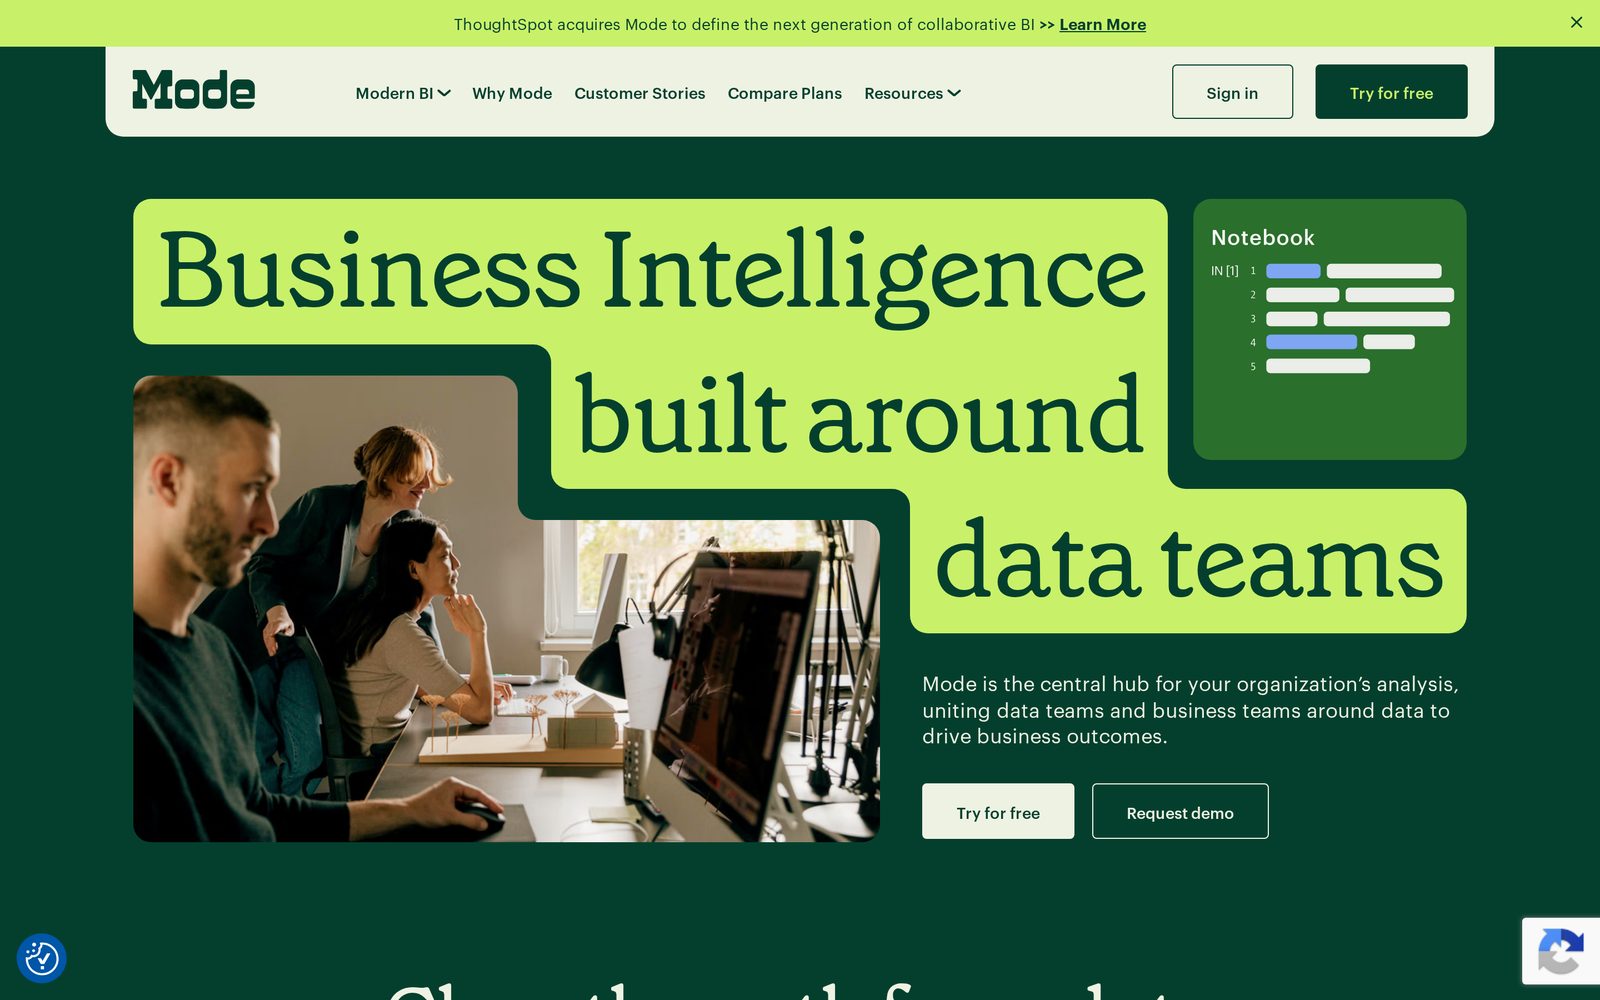
Homepage — typographic blocks, product panel and team imagery
- Typography
- Headlines built as solid colour blocks
- Product
- Notebook and query interface shown in place
- Explainer
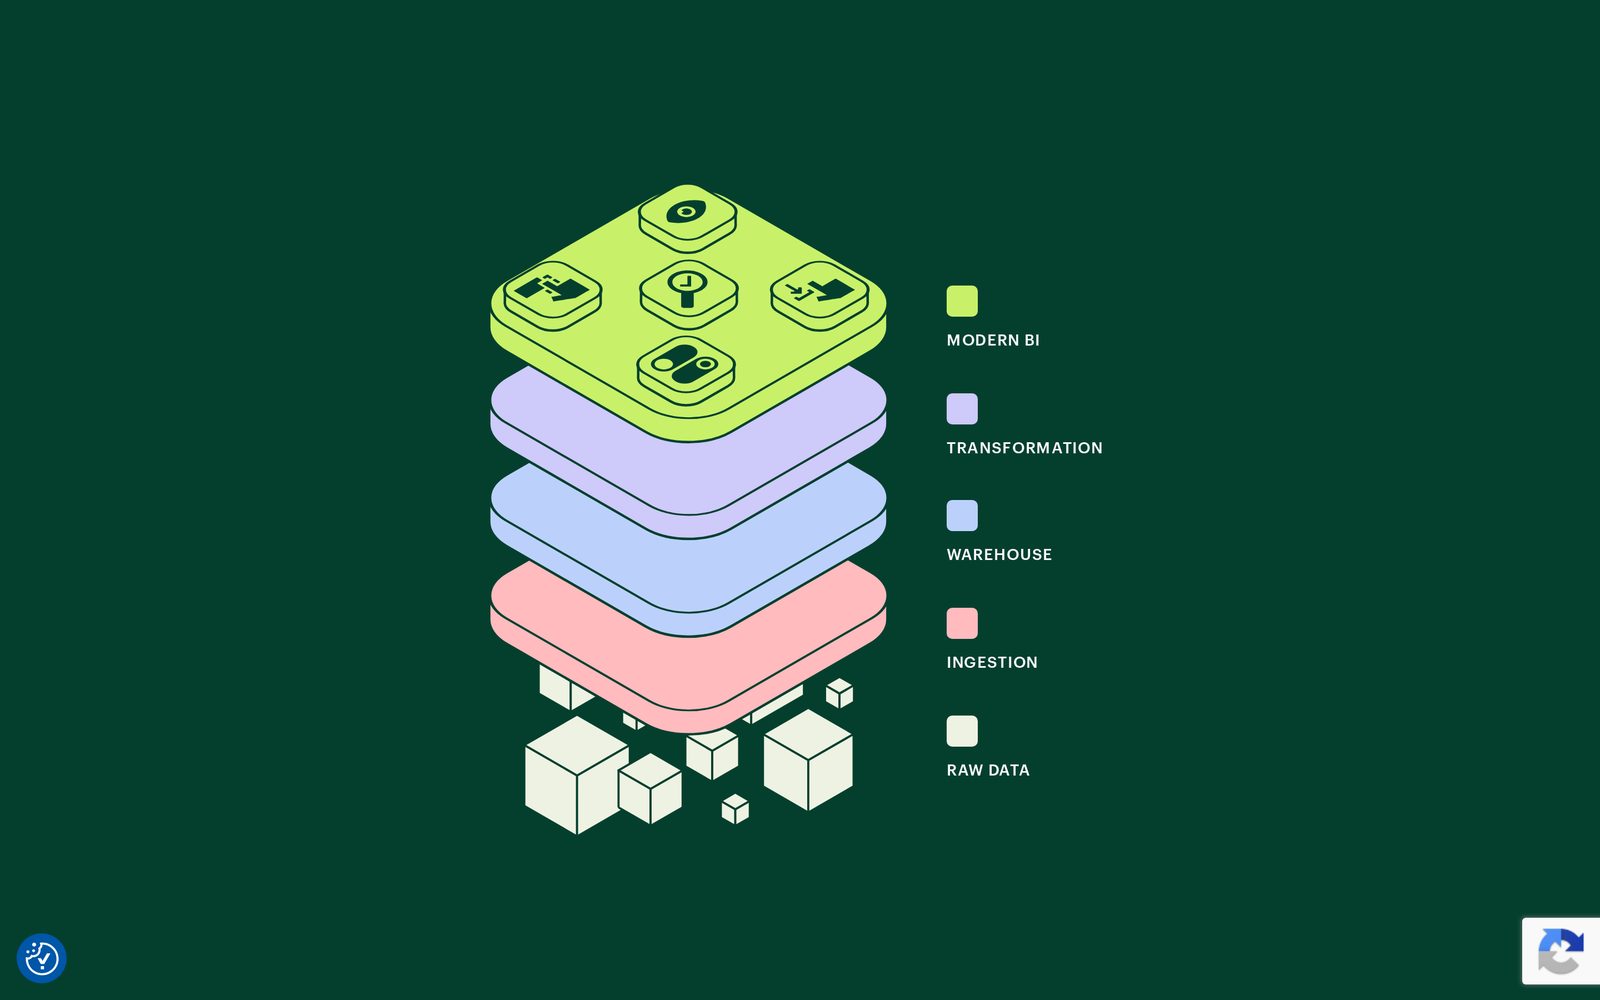
- Isometric data-stack diagram, five layers
- Live
- mode.com
Services
- UI/UX Design
- Web Development
- Design system
- Conversion structure
Build
- React
- Component-driven layout
- Isometric SVG system
- Analytics-ready CTAs
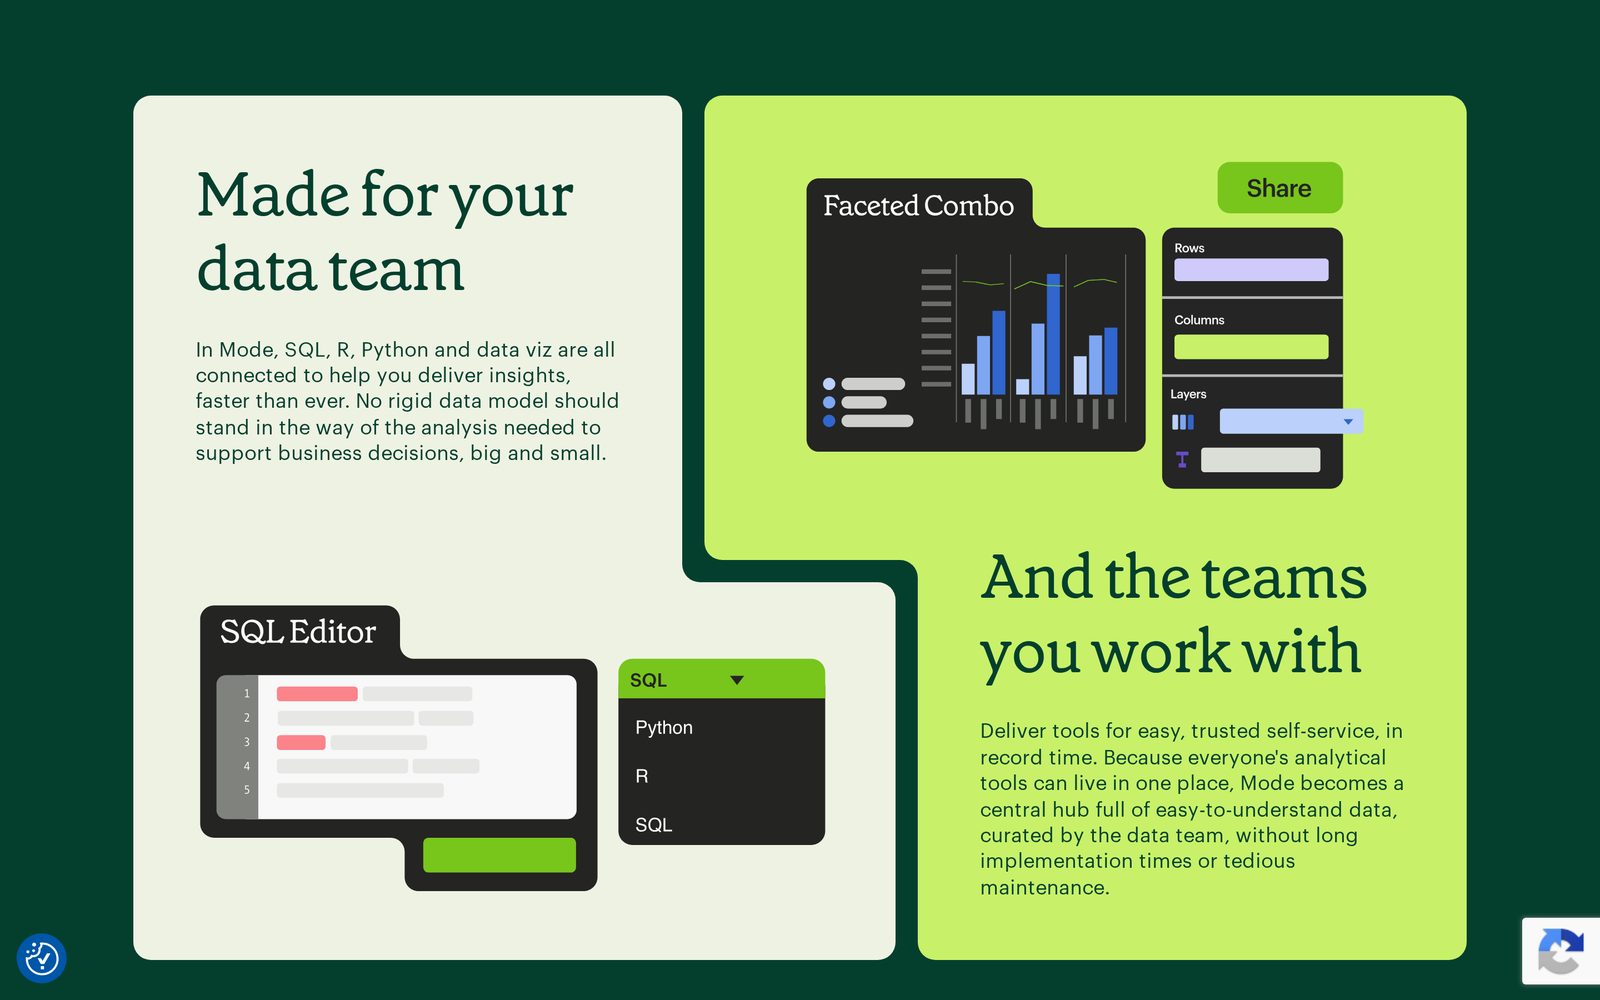
How the interface works.
Enterprise software usually drowns in features. Here the headline is treated as a graphic system — solid type blocks that carry the message before a single paragraph is read — and the platform is explained through one honest diagram of the data stack instead of ten. Product screenshots stay legible at every width, and every section ends with a decision, not a dead end.
Desktop, tablet, phone.
The same interface captured at three widths from the live site — layout, type scale and navigation resolved for each.

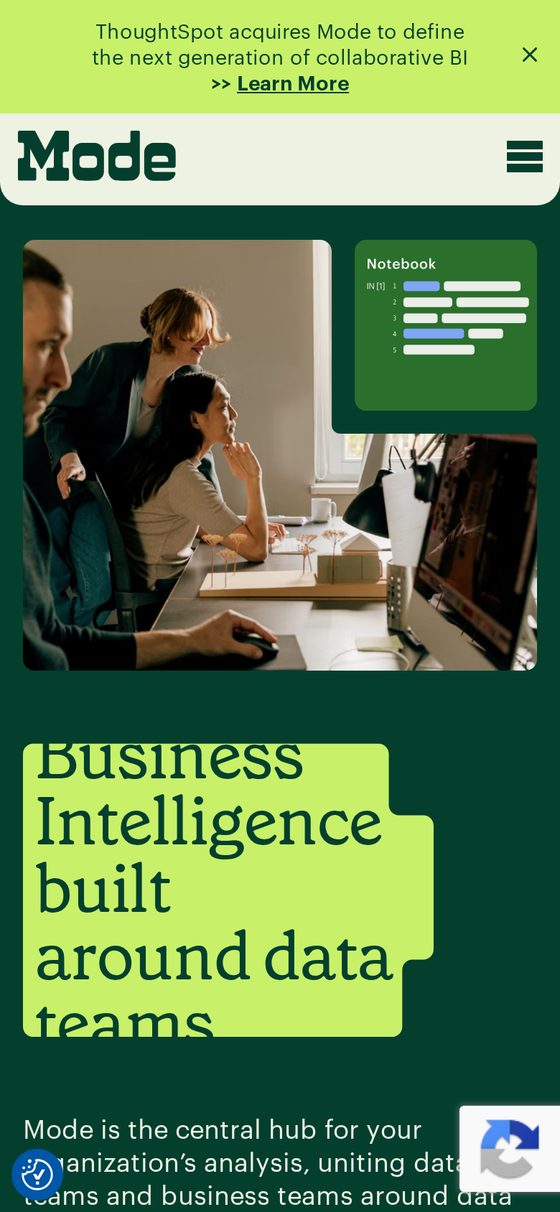
Built for the smallest screen too.

Want work documented like this?
Tell us what you're building and we'll come back with a clear direction, scope and timeline.